
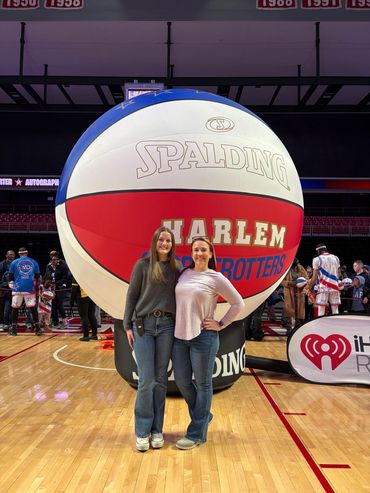
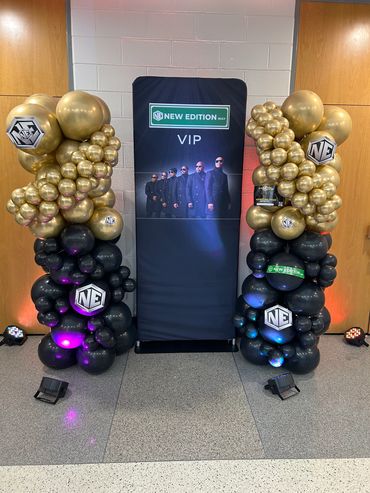
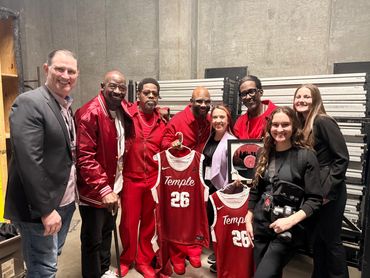
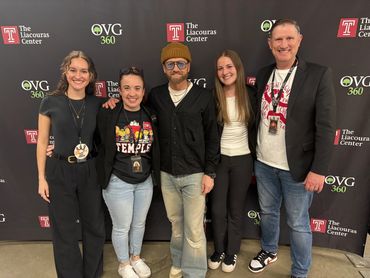
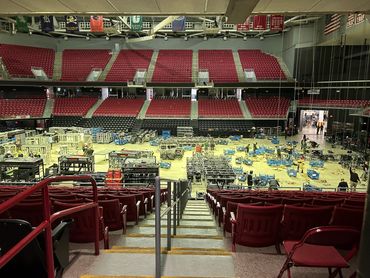
This internship took place over the span of 15 weeks in the spring of 2026. At the Liacouras Center, I worked for Oak View Group as the Event Management Intern. As the intern to the Director of Events, my role included taking charge on several important event processes, such as door set-up and breakdown, conference space oversight, event staff scheduling, and overseeing the lost & found program. A significant portion of my responsibilities focused on supporting the planning and execution of concerts, sporting events, and other large-scale events hosted at the arena. I assisted with coordinating event logistics, preparing operational documents, monitoring event spaces, and ensuring event staff were properly scheduled and informed of their assignments. On event days, I worked closely with multiple departments to help maintain efficient operations, address guest needs, and respond to unexpected situations in real time.
Technical skills: Two-way radio communication, walk-through mags operation, and ticket scanners (Ticketmaster).
Soft skills: Communication, adaptability, problem-solving, teamwork, and time management.
I gained hands-on experience with live event operations and learned how large-scale events are planned, coordinated, and executed within a multi-purpose arena environment. This allowed me to develop a deeper understanding of crowd flow management, real-time communication systems, event logistics, and cross-departmental coordination across a diverse range of events. Throughout this experience, I gained insight into the extensive planning that takes place behind the scenes to create a successful guest experience. Challenges I often encountered included responding to unexpected issues on event days, adapting to last-minute operational changes, and assisting guests with unique needs or concerns. I overcame these challenges by remaining flexible, communicating effectively with team members, utilizing available resources, and making informed decisions in a fast-paced environment.


I managed the event staff schedules and day of sign-in sheet. My role was to create google forms every month to send out to the event staff for them to input their availability. After each deadline, I went in and put in each of their availability into the Excel spreadsheet. Then, I scheduled every person who submitted a google form for every event during that month. Once that spreadsheet was created, my supervisor sent it out to all the event staff. For the sign-in sheet, I listed every person that was scheduled and assigned them a position for that event. In addition, if my supervisor got caught up doing something on event day, I would step in and brief the event staff. About 30-40 minutes before doors, I would give them an overview of the event by giving them key information that they should know and what they should expect throughout the night.
When completing these tasks, I gained a comprehensive understanding of workforce scheduling, data management, and event staffing operations, such as availability systems, optimizing staff positions, and leading pre-event briefings to endure efficient execution.
Technical skills: Excel for spreadsheets and Google forms for availability.
Soft skills: Attention to detail, organization, communication, and leadership.
I would highlight this experience to showcase my organization, attention to detail, and leadership. For a STAR example (Situation, Task, Action, Result), I would describe the "Situation" of managing monthly staff scheduling for many event employees. My "Task" was to ensure that all staff were properly scheduled, accounted for on the sign-in sheet, and fully prepared before the event began. The "Action" was to create and distribute a Google Form to collect staff availability, then complied all responses into an Excel spreadsheet to build the monthly schedule. On event day, if my supervisor was occupied, I stepped in to manage the sign-in sheet and led the pre-event briefing. I communicated key event details, assigned positions, and made sure everyone understood their roles and expectations before doors opened. The "Result" was that the event staff were organized, informed, and ready on time, and the event ran smoothly without delays or confusion.

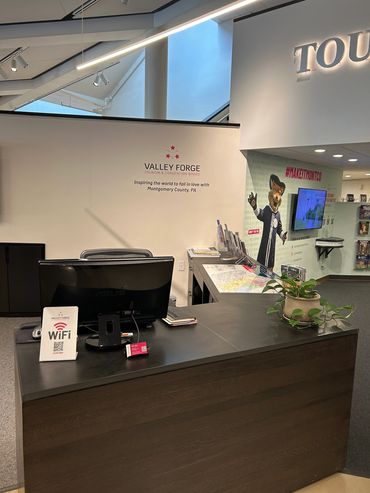
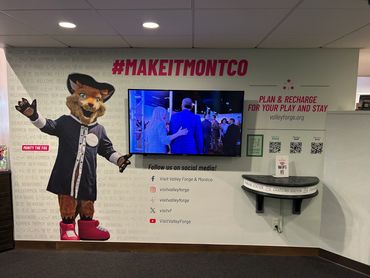
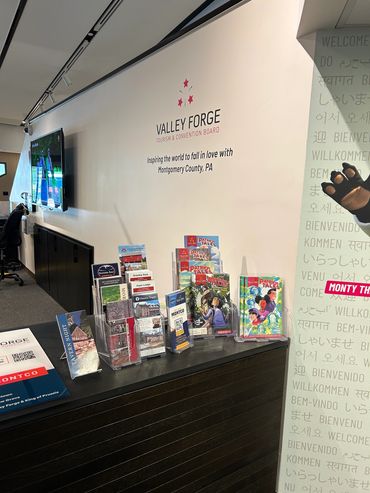
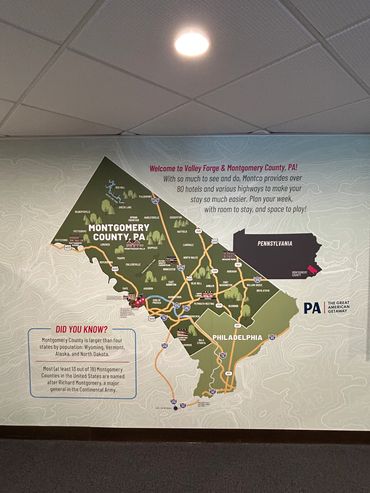
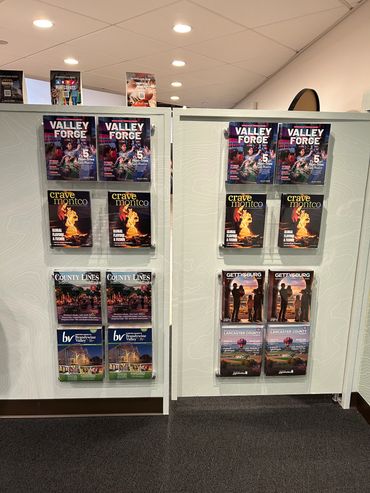
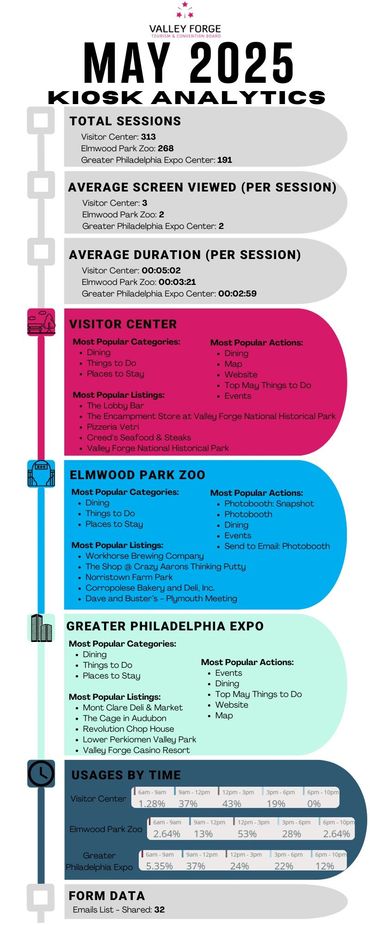
This internship took place over the span of 12 weeks in the summer of 2025. At Valley Forge Tourism and Convention Board (TCB), I was the Visitor Services Intern. Majority of my time was spent at the Visitor Center at Valley Forge National Historical Park. My role was to represent the TCB and assist visitors with helpful Montgomery County tourism information. For instance, where to go for dining, places to stay, and things to do in the surrounding area. Because Valley Forge National Historical Park is a federal park, the park rangers and volunteers can’t recommend businesses in the area. That is where the TCB and my role came in to market the businesses and attractions in Montgomery County. In addition, I helped maintain and organize proper quantities of local and regional brochures and contact sources to maintain inventory to prevent from running out of information.
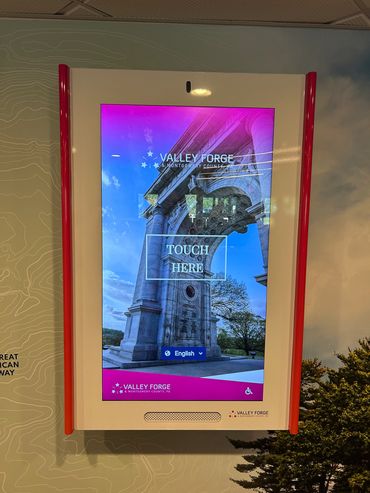
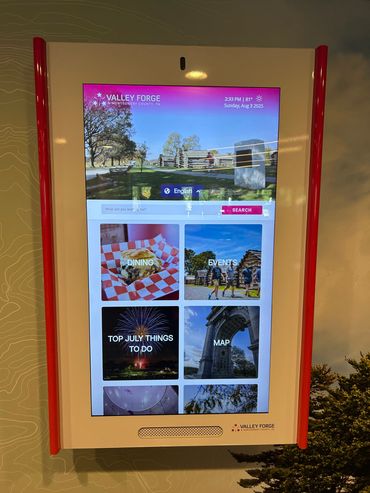
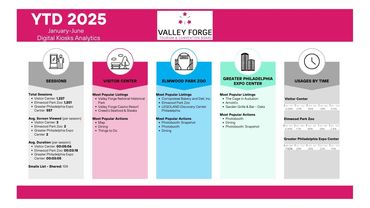
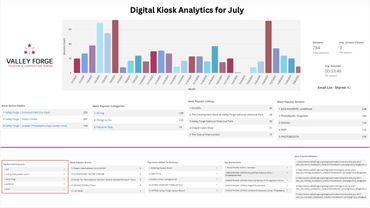
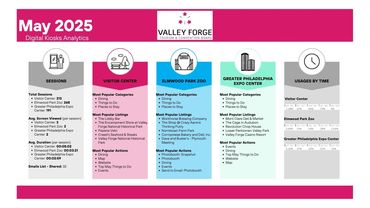
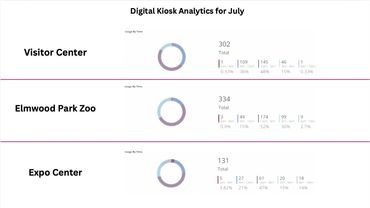
Technical skills: Event planning software (e.g., TicketSignUp), Microsoft Excel for creating spreadsheets to keep track of where visitors are traveling from, TrueOmni digital kiosk at the Visitor Center to guide guests with tourism information in Montgomery County, and Vally Forge’s website for additional tourism information about Montgomery County.
Soft skills: Customer service, communication, collaboration, attention to detail, problem solving, and adaptability.
I gained hands-on experience with visitor services and learned how destination marketing organizations, like TCB, promote local attractions. This allowed me to gain a deeper understanding of Montgomery County’s businesses, attractions, and cultural assets and learn how to promote these assets to different visitor demographics. Challenges I often encountered were receiving questions that I was unsure of. I overcame these challenges by utilizing my resources and problem-solving on the spot to help tourists plan their visits.


I created infographics to showcase the analytics for the digital kiosks located at the Visitor Center, Elmwood Park Zoo, and the Greater Philadelphia Expo Center. Every month, my supervisor and I would analyze the analytics of all three locations to identify trends, common behaviors, or errors that may have appeared. My role was to collect and pull together the data to create a visual presentation for the team and the CEO.
When completing this project, I learned new technologies, such as TrueOmni to gather the analytics for the digital kiosks. I gained a deeper understanding of what TrueOmni is and how it is a beneficial software for the tourism industry. For instance, TrueOmni pioneers digital self-service solutions, transforming visitor experiences across industries with cutting-edge technology. Also, I gained the understanding of user engagement data, as well as the value of the data for maintaining and improving user experience. Additionally, transforming raw data into compelling, easy-to-understand infographics.
Technical skills: Analytics software (e.g., TrueOmni), Canva to create infographics, Asana to upload slides for team meetings.
Soft skills: Attention to detail, collaboration, analytical thinking, and time management.
I would highlight this experience to showcase my analytical thinking and attention to detail to create visual representations for analytic reports. For a STAR example (Situation, Task, Action, Result), I would describe the “Situation” as the Visitor Center, Elmwood Park Zoo, and the Greater Philadelphia Expo Center having digital kiosks that can be used to promote tourism in Montgomery County. These kiosks collect usage data that only my supervisor and the Digital Marketing Manager have access to. My “Task” was to collect and organize the data each month, then create visual reports that would help the team, and the CEO understand user engagement and any potential issues. The “Actions” I took was reviewing the analytics for all three kiosks either by myself or with my supervisor each month. I used Canva to create infographics that showed key metrics and trends. If I noticed low engagement with certain content, I notified my supervisor for further discussion. The “Result” of the analytic reports helped the Marketing team make faster decisions about kiosk updates and content strategy. My infographics were consistently used in team meetings and became a standard reporting tool for the team.


We use cookies to analyze website traffic and optimize your website experience. By accepting our use of cookies, your data will be aggregated with all other user data.